



1 Statistical questions / 3 pts
Say whether each question is statistical. Justify in one sentence each.
- How many students in our school ride the bus?
- How many players are on a basketball team on the court?
- How many text messages do the students in Grade 6 send per day?
2 Measures of center and range / 4 pts
Nine students counted the books on their shelves: 12, 15, 9, 14, 15, 10, 16, 15, 11. Find the mean, the median, the mode and the range.
3 Five-number summary / 4 pts
Ten runners finished a race in these times (minutes): 4, 6, 7, 9, 10, 12, 13, 15, 16, 20. Give the five-number summary, then find the IQR and the range.
4 Mean absolute deviation / 3 pts
Find the MAD of the data 5, 7, 8, 10, 15.
5 Reading a histogram / 3 pts
The histogram shows the points scored by a team in 20 games.
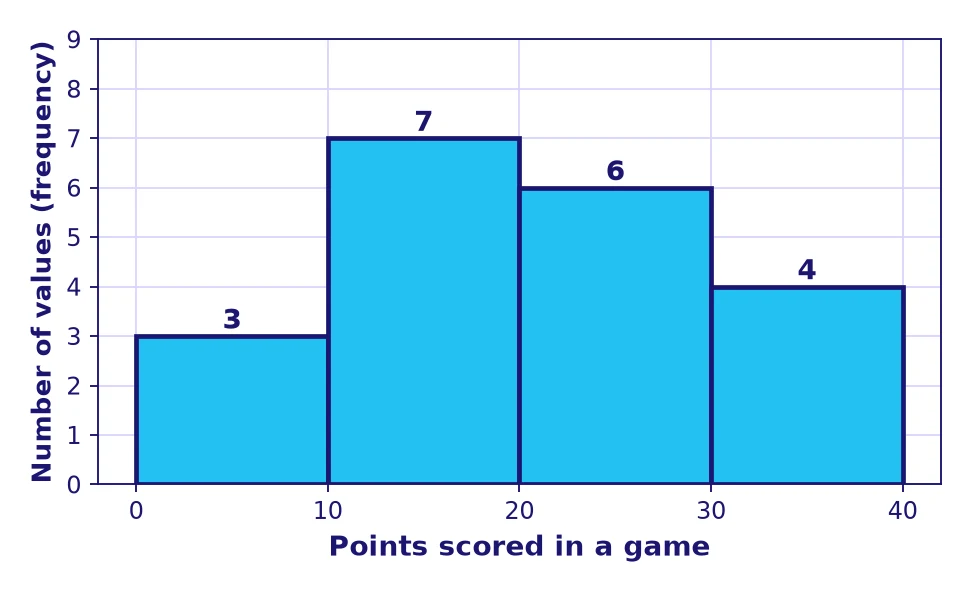
- How many games are shown in total?
- In how many games did the team score fewer than 20 points?
- What fraction of the games had 30 points or more?
6 Choosing a measure of center / 3 pts
Seven students timed how long they needed to read a page (minutes): 12, 13, 13, 14, 15, 16, 43. Find the mean and the median. Which one better describes a typical time? Explain.

Test yourself: quick challenge for Grade 6
🚀 Keep exploring with Zyro
 🏅 Test solutionsStatistics and Data Displays: math test solutions, Grade 6
 📘 Math lessonsStatistics and Data Displays: math lesson, Grade 6
 ✏️ Math practiceStatistics and Data Displays: math practice, Grade 6
 🏅 Test solutionsPercents: math test solutions, Grade 6
 🏅 Test solutionsDividing Fractions: math test solutions, Grade 6
 📘 Math lessonsPercents: math lesson, Grade 6