


22 problems graded by difficulty (★ easy, ★★ medium, ★★★ hard). Try first, without looking at the solutions!
1 Which questions are statistical? ★★★
Decide which questions are statistical and which are not.
- How old is the principal of our school?
- How many minutes do the students in my grade spend reading each night?
- What is the capital of Ohio?
- How tall are the players in the youth soccer league?
2 Reading a dot plot of shoe sizes ★★★
The dot plot shows the shoe sizes of 12 students.
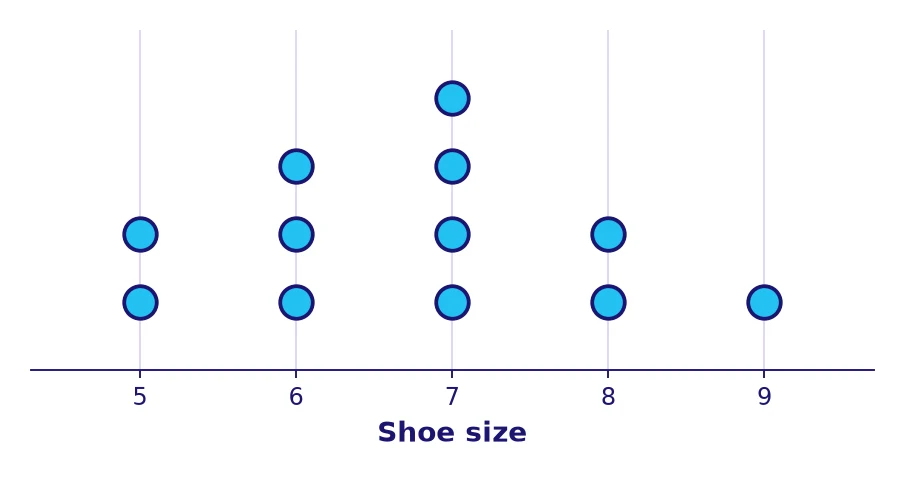
- Which shoe size is the most common?
- How many students wear size 8 or larger?
3 Building a frequency table ★★★
A class recorded the number of rainy days each week for 10 weeks: 3, 1, 2, 3, 3, 2, 4, 3, 1, 2. Make a frequency table and check the total.
4 Mean of five numbers ★★★
Five students ran the following numbers of laps: 8, 6, 9, 7, 10. Find the mean.
5 Median of an odd list ★★★
The temperatures (in °F) at noon were 59, 41, 53, 66, 48. Find the median temperature. (Hint: put the numbers in order first.)
6 Find the mode ★★★
A shop sold these numbers of sandwiches on seven days: 4, 7, 4, 9, 7, 4, 2. Find the mode and say what it means.
7 Range of temperatures ★★★
The daily high temperatures (°F) in a week were 58, 63, 71, 66, 49, 70, 62. Find the range.
8 Median of an even list ★★★
Mia counted the pages she read on six days: 7, 3, 10, 8, 5, 12. Find the median.
9 Fair share of savings ★★★
Four siblings saved 12, 20, 8 and 16 dollars. If they pool the money and share it equally, how much does each get? Does anyone give money to the others?
10 Find the missing score ★★★
Dev’s mean score on five tests is 84. His first four scores are 80, 92, 78 and 85. What was his fifth score?
11 Reading a histogram of plant heights ★★★
The histogram shows the heights of 24 plants.
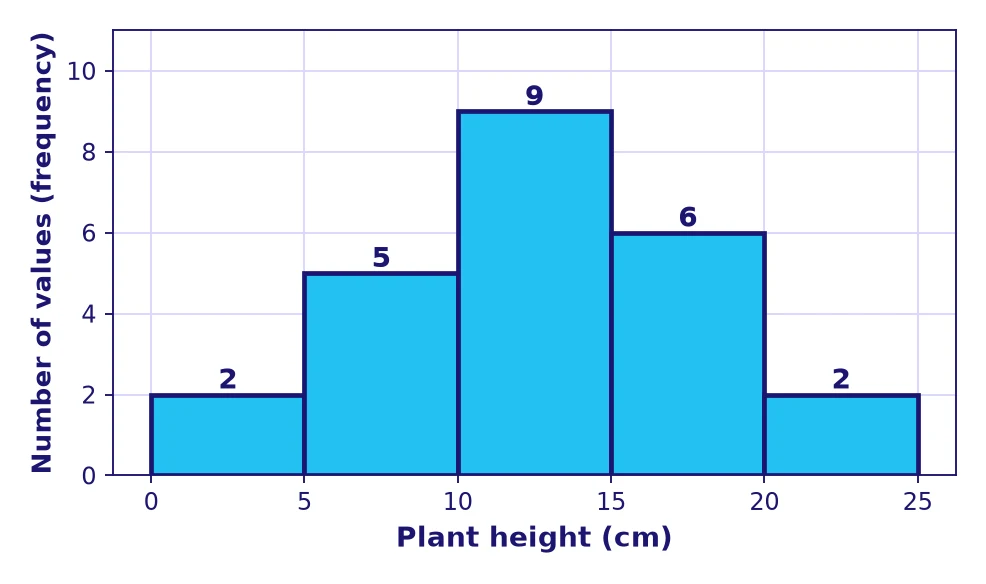
- How many plants are shorter than 10 cm?
- Which bin has the most plants?
- What fraction of the plants are at least 10 cm and shorter than 20 cm?
- Can you tell the exact height of the tallest plant?
12 Five-number summary ★★★
Data: 2, 4, 5, 7, 8, 9, 12, 13, 15. Find the five-number summary and the IQR.
13 The effect of an outlier ★★★
A teacher recorded the minutes 9 students spent on a puzzle: 5, 6, 6, 7, 7, 7, 8, 8, 9. A tenth student took 30 minutes. Find the mean and the median before and after adding the tenth student. Which one changed more?
14 Mean absolute deviation ★★★
Find the MAD of the data 3, 5, 7, 9, 11.
15 Choosing bins for run times ★★★
Ten students ran a lap in these times (seconds): 11, 12, 14, 15, 17, 18, 19, 21, 22, 24. Use bins of width 5 starting at 10 (10–15, 15–20, 20–25) to make a frequency table. Each bin includes its left end but not its right end.
16 Same mean, different spread ★★★
Team A scored 10, 12, 14, 16, 18 points in five games. Team B scored 6, 10, 14, 18, 22 points. Compare the two teams using the mean and the MAD. Which team is more consistent?
17 Comparing two box plots ★★★
The box plots show the test scores of two classes.
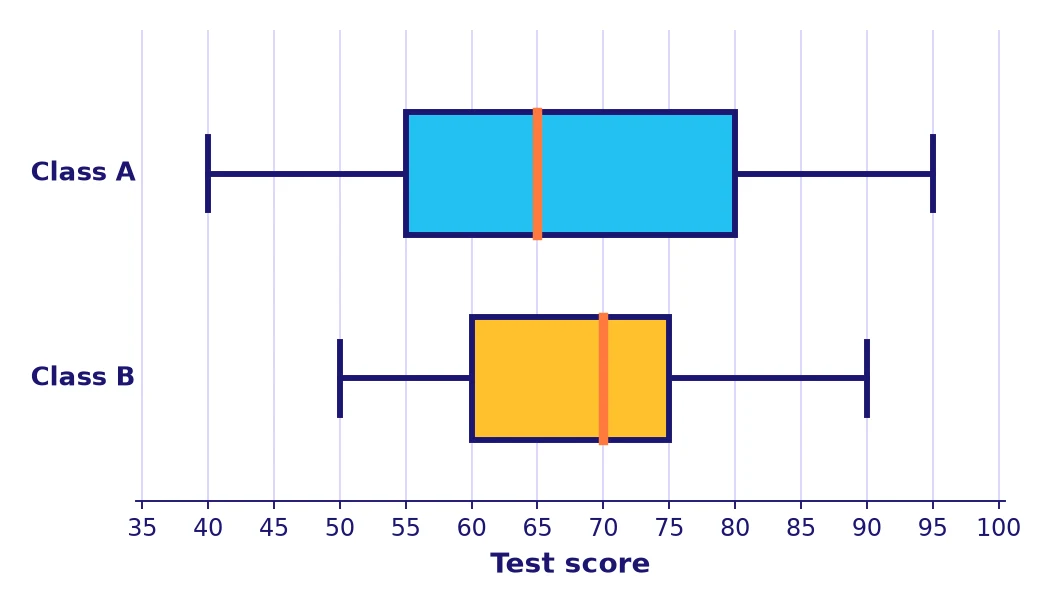
- Give the median of each class.
- Find the range and the IQR of each class.
- Which class has the more consistent middle half of scores? Explain.
18 A missing value from the mean ★★★
Five numbers in order are 4, 7, \(x\), 12, 15 and their mean is 9.6. Find \(x\) and check that the list really is in order.
19 Which center describes house prices? ★★★
Seven houses on a street sold for (in thousands of dollars) 210, 225, 230, 240, 250, 255 and 900. Find the mean and the median. Which better describes a typical price, and why?
20 Adding a new score ★★★
Five scores are 6, 8, 10, 12, 14. A sixth score of 22 is added. How do the mean and the median change?
21 The balance point ★★★
Four dots are at 2, 2, 3 and 9 on a number line. Find the mean and show that the distances below the mean and the distances above the mean have the same total.
22 Describe the distribution ★★★
A histogram of the minutes 20 students spent playing video games has these bins and frequencies: 0–20: 2; 20–40: 4; 40–60: 8; 60–80: 5; 80–100: 1. Describe the shape, say which bin contains the median, and decide whether the mean and MAD or the median and IQR are the better choice.


Test yourself: quick challenge for Grade 6
Speed drill for Grade 6: how many in 60 seconds?
🚀 Keep exploring with Zyro
 ✅ Practice solutionsStatistics and Data Displays: practice solutions, Grade 6
 📘 Math lessonsStatistics and Data Displays: math lesson, Grade 6
 🎯 Math quizzesStatistics and Data Displays: math quiz, Grade 6
 ✅ Practice solutionsPercents: practice solutions, Grade 6
 ✅ Practice solutionsDividing Fractions: practice solutions, Grade 6
 📘 Math lessonsPercents: math lesson, Grade 6